gix-blame performance March 2026 through July 2026

code
analysis
Author

Christoph Rüßler

Published

July 19, 2026

Modified

August 10, 2026

Note

If you’re wondering why there’s earlier posts in this blog even though the first paragraph mentions this is the first post: the other, earlier posts were published on my main blog before this blog existed and then later imported with their original publication date.

This is the first post in a new blog in which I plan to infrequently post performance analyses related to gitoxide. This post is largely a port of existing code I used in two previous blog posts (one measuring the difference between using imara-diff 0.1 and 0.2, another one measuring the effects of optimizing tree diffing by skipping identical subtrees), and it mainly exists to exercise the new publishing pipeline. The reason I’m now starting this separate blog is that my main blog runs on Jekyll which is not as well suited to the kinds of analyses that I want to work on from time to time as Quarto which is the software behind this new blog.

In this post, I’m going to compare gix blame at commit e63d487fb (from February 16, 2026) with gix blame at commit 9949e9fdf (from July 19, 2026) (the latter chosen because it happened to be HEAD when I started writing this post). Specifically, I’m going to compare the performance of gix blame on the same set of 9 files that I used for the benchmarks of my earlier posts.

Running the benchmark

After compiling both executables with cargo build --release --locked, I ran the following script to collect some data using hyperfine.

env GIT_DIR="$HOME/github/Byron/gitoxide/.git" BASELINE_EXECUTABLE="$HOME/bin/gix-2026-07-20-e63d487fb" COMPARISON_EXECUTABLE="$HOME/bin/gix-2026-07-20-9949e9fdf" ./run_benchmark.py
run_benchmark.py, the script used to benchmark both versions of gix blame
#!/usr/bin/env python
# /// script
# requires-python = ">=3.13"
# ///

import os

def run(path, i):
    os.system(
        f'hyperfine --parameter-list command "$BASELINE_EXECUTABLE","$COMPARISON_EXECUTABLE" --parameter-list path {path} "{{command}} blame {{path}}" --command-name baseline --command-name comparison --export-json benchmark-{i}.json'
    )

for i, path in enumerate(
    [
        "CHANGELOG.md",
        "STABILITY.md",
        "README.md",
        "Cargo.toml",
        "gix-blame/src/file/function.rs",
        "gix-path/src/env/mod.rs",
        "gix-index/tests/index/file/write.rs",
        "gix-object/src/lib.rs",
        "gix-odb/src/store_impls/loose/write.rs",
    ]
):
    run(path, i + 1)

This will create a couple of Markdown files, benchmark-1.json through benchmark-9.json.

Loading the data

Then, in order to work with these files, we’re going to use numpy and pandas to load them into data.

A few helper functions for loading the data
import numpy as np
import pandas as pd

import matplotlib as mpl

import seaborn as sns

import json

def load_results(filename):
    with open(filename) as f:
        return json.load(f)["results"]

def extract_data_points(result):
    command = result["command"]
    path = result["parameters"]["path"]

    return {"command": command, "path": path, "time": result["times"]}
filenames = [f"benchmark-{i}.json" for i in range(1, 10)]
results = [load_results(filename) for filename in filenames]
results = [extract_data_points(result) for result in np.concatenate(results)]

data = pd.concat(
    [pd.DataFrame(result) for result in results],
    ignore_index=True,
)

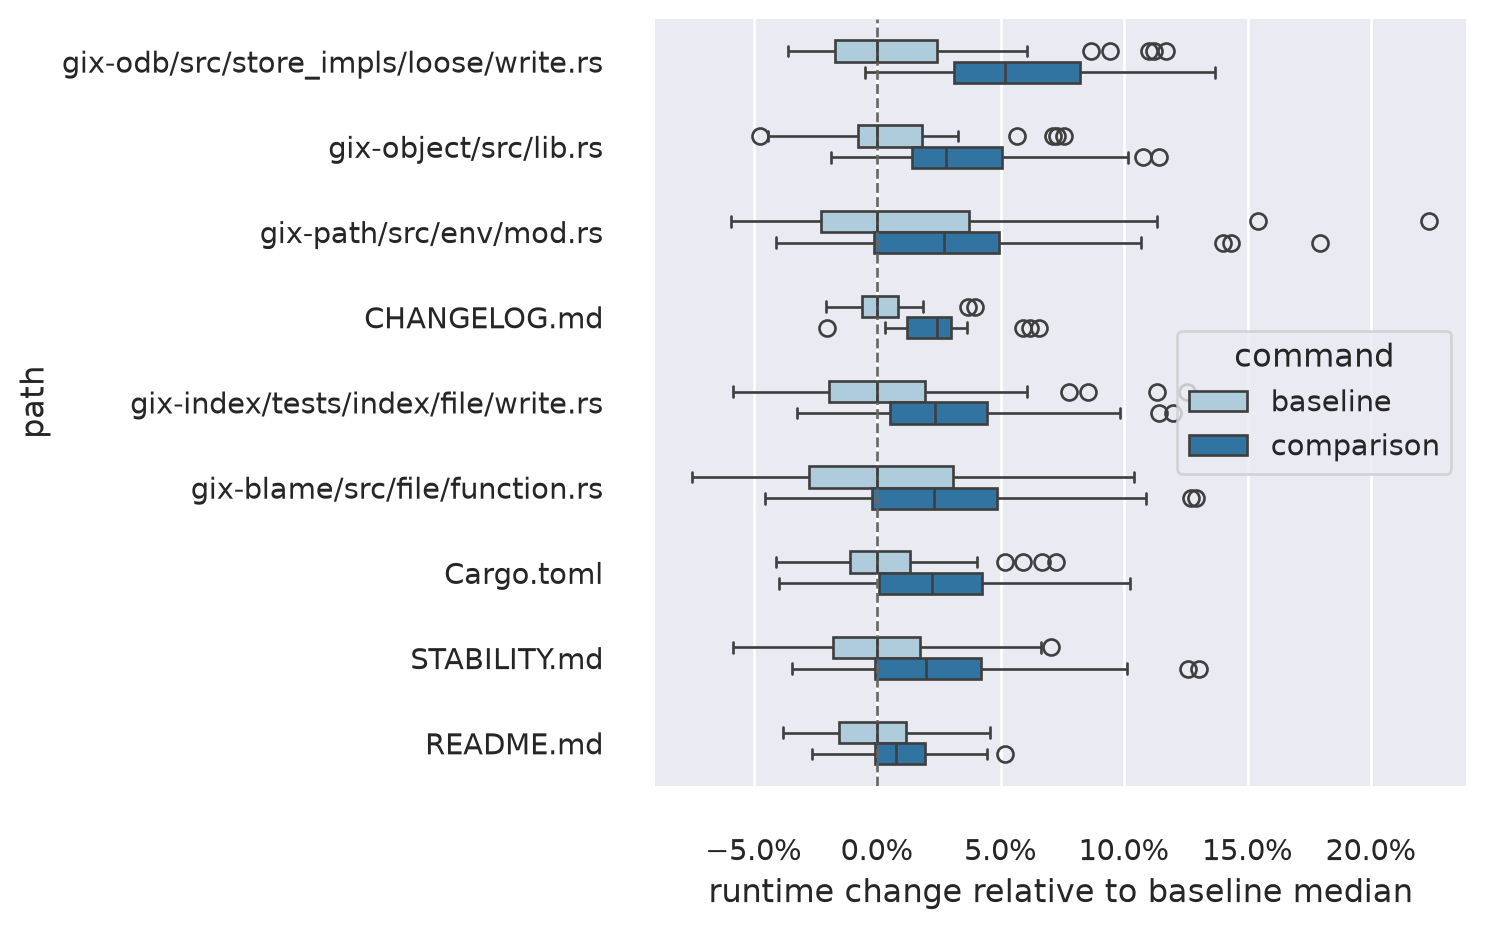
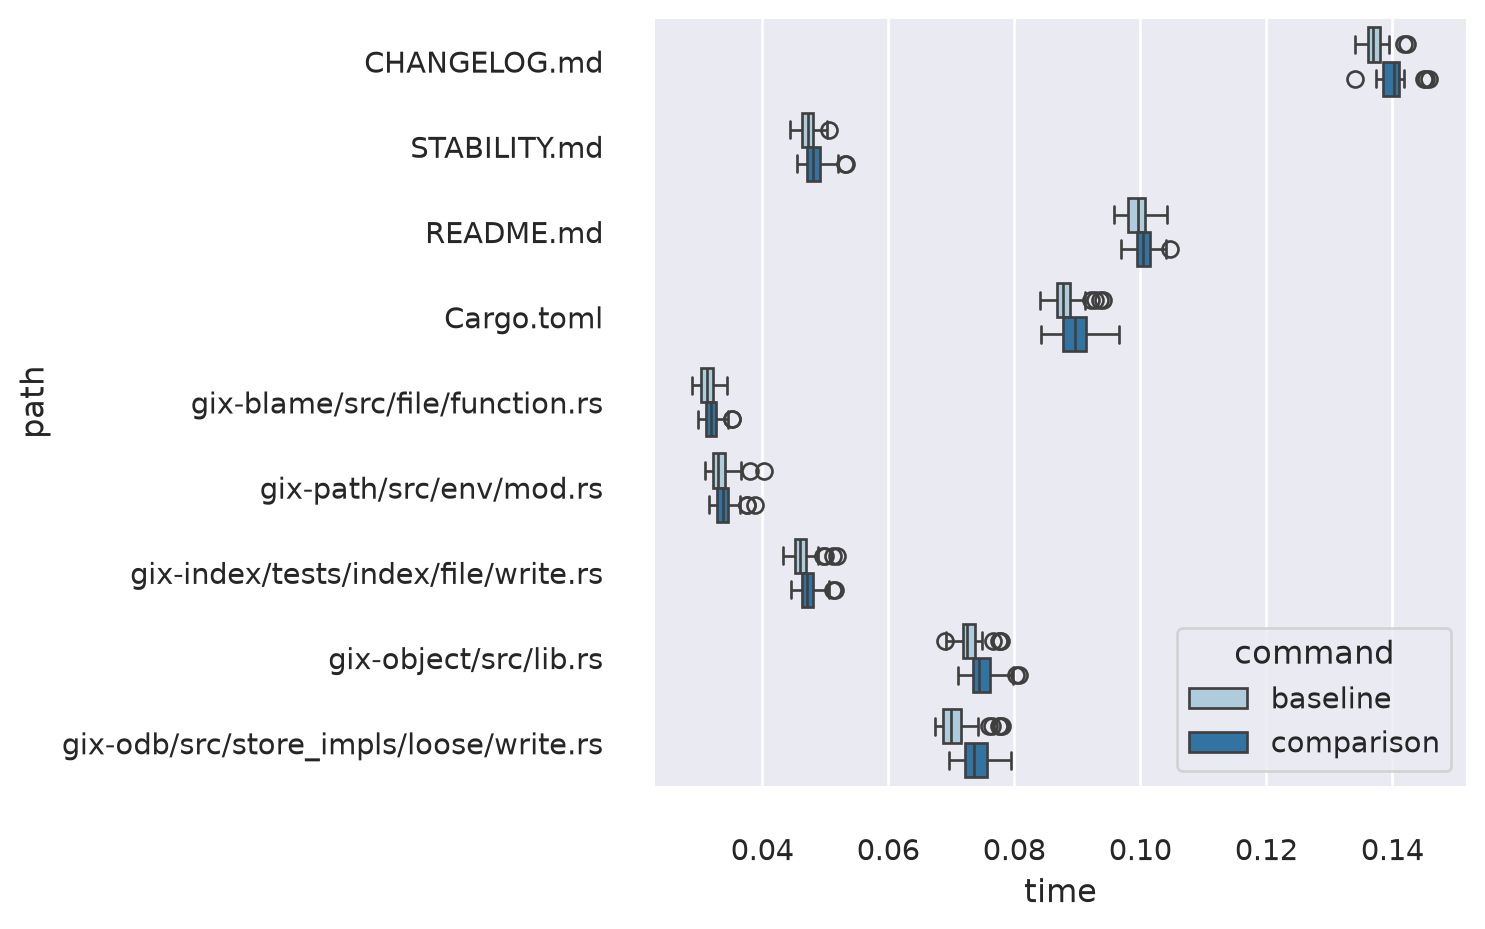
And finally, we’re going to create 2 plots that will give us an idea of how both versions of gix blame compare with respect to performance. Looking in particular at the boxplot, it seems that performance slightly regressed between March and July.

Creating a boxplot

Code
FIGURE_WIDTH = 8
FIGURE_ASPECT = 1.6

sns.set_theme(
    palette="Paired",
    rc={"figure.figsize": (FIGURE_WIDTH, FIGURE_WIDTH / FIGURE_ASPECT)},
)
boxplot = sns.boxplot(x="time", y="path", hue="command", data=data)
sns.despine(offset=10, trim=True)
mpl.pyplot.tight_layout()
mpl.pyplot.show()

Creating a stripplot

mpl.pyplot.figure(figsize=(FIGURE_WIDTH * 0.75, FIGURE_WIDTH / FIGURE_ASPECT))

stripplot = sns.stripplot(
    x="time",
    y="path",
    hue="command",
    dodge=True,
    size=2.5,
    jitter=0.2,
    legend=False,
    data=data,
)

mpl.pyplot.show()

Conclusion

Aggregating the data in a table confirms the initial impression we got from both plots: in this sample, gix-blame seems to have gotten slightly slower across the board, with losses of more than 4 % in one case. I don’t know yet whether this is due to a particular change, and the effect is not dramatic, but I plan on investigating this more in-depth in the future if time permits.
Code
summary = (
    data
    .groupby(["path", "command"])
    .agg(
        mean=("time", "mean"),
        stddev=("time", "std"),
    )
    .reset_index()
)

summary["mean_ms"] = summary["mean"] * 1000
summary["stddev_ms"] = summary["stddev"] * 1000

wide = summary.pivot(
    index="path",
    columns="command",
    values=["mean_ms", "stddev_ms"],
)

table = pd.DataFrame({
    "baseline_mean_ms": wide["mean_ms"]["baseline"],
    "baseline_stddev_ms": wide["stddev_ms"]["baseline"],
    "comparison_mean_ms": wide["mean_ms"]["comparison"],
    "comparison_stddev_ms": wide["stddev_ms"]["comparison"],
})

table["Δ ms"] = table["comparison_mean_ms"] - table["baseline_mean_ms"]
table["Δ %"] = table["Δ ms"] / table["baseline_mean_ms"] * 100
table["ratio"] = table["comparison_mean_ms"] / table["baseline_mean_ms"]

table = table.sort_values("Δ %", ascending=False)

display_table = pd.DataFrame({
    "path": table.index.to_list(),
    "baseline mean ± sd": [
        f"{mean:.2f} ± {sd:.2f}"
        for mean, sd in zip(table["baseline_mean_ms"], table["baseline_stddev_ms"])
    ],
    "comparison mean ± sd": [
        f"{mean:.2f} ± {sd:.2f}"
        for mean, sd in zip(table["comparison_mean_ms"], table["comparison_stddev_ms"])
    ],
    "Δ ms": table["Δ ms"].to_list(),
    "Δ %": table["Δ %"].to_list(),
    "ratio": table["ratio"].to_list(),
})

display_table.style.format({
    "Δ ms": "{:+.2f}",
    "Δ %": "{:+.2f}%",
    "ratio": "{:.3f}×",
}).background_gradient(
    subset=["Δ %"],
    cmap="Reds",
).hide(axis="index")
path baseline mean ± sd comparison mean ± sd Δ ms Δ % ratio
gix-odb/src/store_impls/loose/write.rs 70.75 ± 2.83 73.77 ± 2.42 +3.01 +4.26% 1.043×
gix-object/src/lib.rs 72.82 ± 2.04 75.00 ± 2.30 +2.17 +2.98% 1.030×
STABILITY.md 47.24 ± 1.28 48.36 ± 1.82 +1.11 +2.36% 1.024×
gix-index/tests/index/file/write.rs 46.26 ± 1.69 47.31 ± 1.47 +1.05 +2.26% 1.023×
gix-blame/src/file/function.rs 31.33 ± 1.29 32.02 ± 1.20 +0.69 +2.21% 1.022×
CHANGELOG.md 137.27 ± 2.21 140.25 ± 2.75 +2.98 +2.17% 1.022×
Cargo.toml 87.97 ± 2.54 89.78 ± 3.02 +1.80 +2.05% 1.020×
gix-path/src/env/mod.rs 33.30 ± 1.59 33.83 ± 1.44 +0.53 +1.60% 1.016×
README.md 99.88 ± 2.30 100.73 ± 1.79 +0.84 +0.84% 1.008×